
RELATIONSHIP BETWEEN DRIVING RISK AND ACCIDENT : THE “S” CURVE THEORY
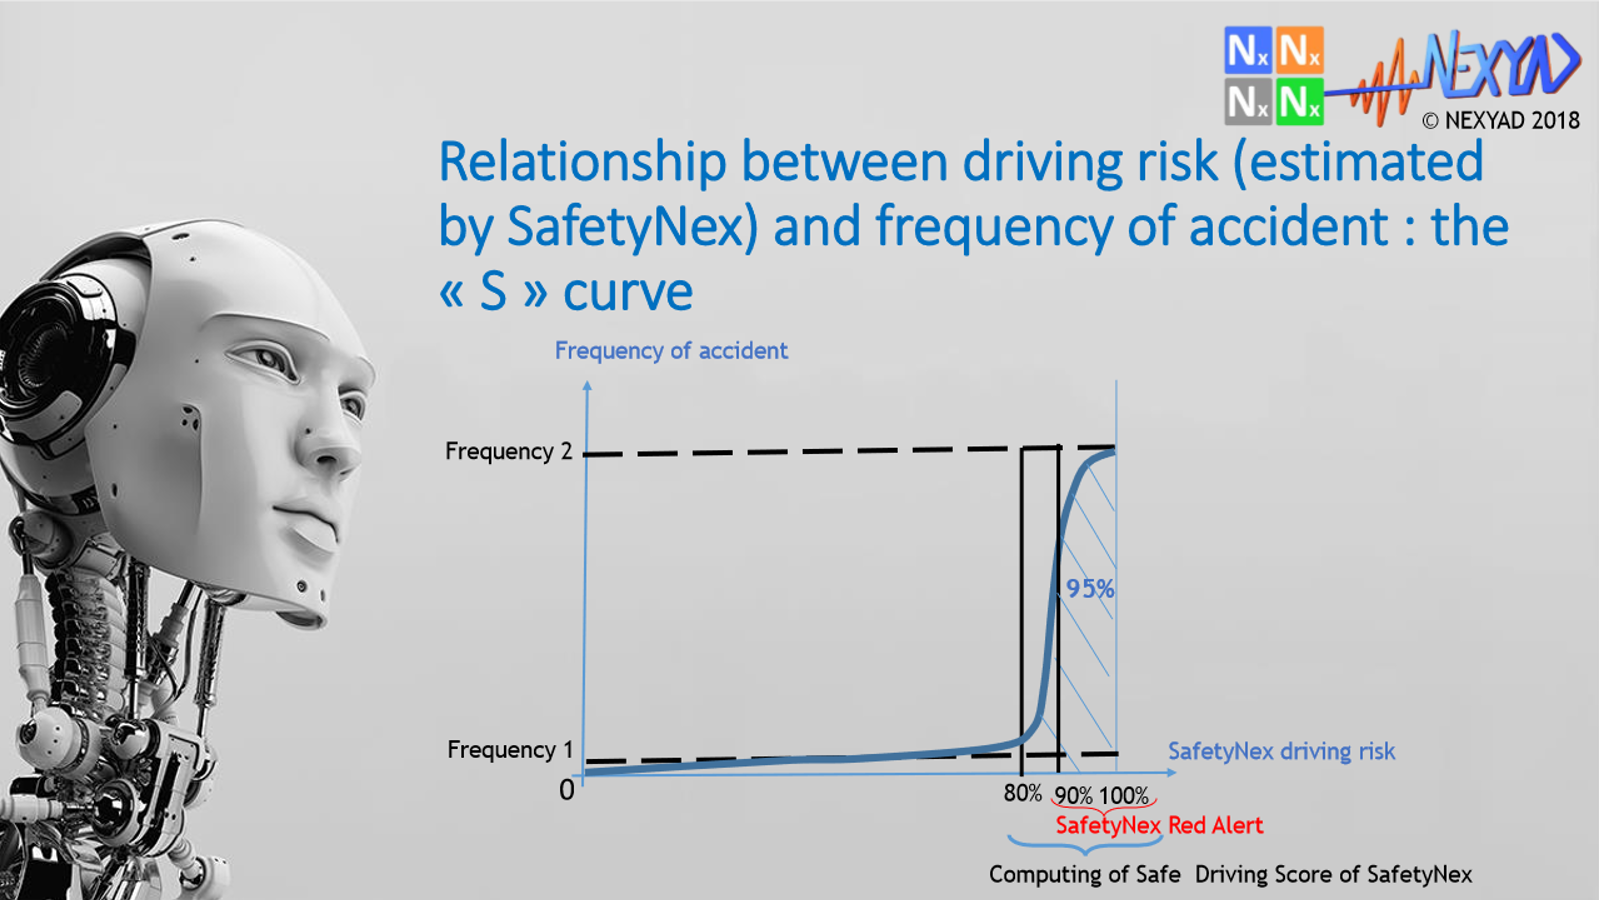
Let’s say in a manufacture there is a very dangerous machine that may grind up your hand. If you are 10 km away from the machine, risk is “very” low. If you are 1 km away from the machine, risk is the same. If you are 10 m away from the machine … risk is still very low … but if you come closer (let’s say 10 cm), suddenly risk becomes high ! This is not linear. In road safety, the Artificial Intelligence algorithm SafetyNex estimates 20 times per second the driving risk you take, and many people ask about relationship between “risk you take” and “accident”. This relationship is not deterministic (probabilities must be used) : risk is not linked directly to accident but rather to accident frequency (or probability) … and the relationship is a non linear curve called a “S” curve as shown on the figure below. It is possible then to use it to alert human driver (Vocal Driving Assistants) or to control autonomous driving (Autonomous Vehicle) in order to keep risk under the threshold of the “S” curve or not too far after the threshold. SafetyNex was calibrated in order to have 95% of accident frequency just after the threshold (validated on 50 million km).
Click image to enlarge